Category Archives: renewable energy

Photovoltaic array monitoring

A previous post covered how the inverter is an integral part of our 26 module, 8.58 kW photovoltaic array. Both, the inverter and the array, service our 4,500 sf building with its three apartments/households.

The inverter allows us to monitor our kilowatt hour (kWh) production in real time, either through an android/iOS or web app. The app interface also gives us access to historical production data, such as the past three years (2020 – 2022).

During those three years, the lowest monthly production on record was for December 2022 with a meager 273 kWh. Our worst production day was January 31, 2021 with 1 Wh due to a foot of snow on the modules.

June 2022 gave us the highest monthly production with 1,495 kWh, and the best daily yield so far fell on May 29, 2021 with 68.7 kWh.

Our array averaged 11,000 kWh in annual production from 2020 through to 2022, which is within 4% of what we were aiming for (11,459 kWh).

The 11,000 kWh for our 4,500 sf building breaks down into 3,667 kWh of self-produced electricity per household per year, or 305.6 kWh per household per month.

Annual production overview
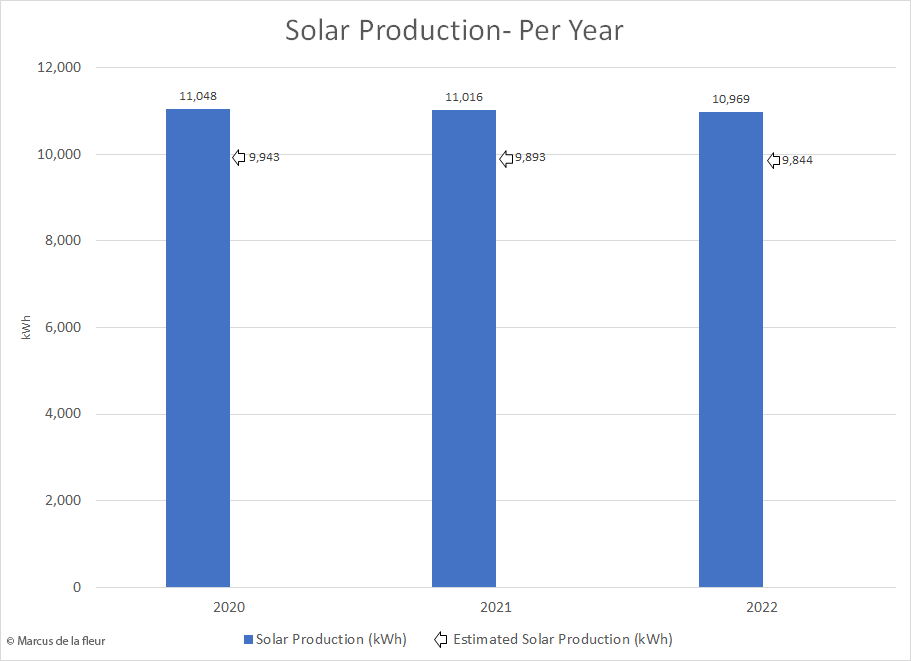
Even though some months are sunnier than others, and despite the solar irradiation varying each year for any given month, the production across the year is remarkably consistent with an average of 11,000 kWh per year.

The overall small production decline since 2020 reflects the estimated annual system decrease, which is specified to average 0.26% per year for our Panasonic 330 watt modules.

While planning the system with our solar installer Lisa Albrecht from All Bright Solar, we targeted an annual production of 11,459 kWh. 11,000 kWh per year brought us within 4% of that goal. Some shading during the winter months from an adjacent tree was likely responsible for the 4% shortfall.

The “Estimated energy” is the minimum amount of energy we need to produce to fulfill our contractual obligations for the state solar incentive we received. The state incentive is based on how much kilowatt hours our 8.58 kW photovoltaic array is predicted to produce over the first 15 years. This number was calculated by our solar installer, and determined our total state incentive amount.

Monthly production overview

The data for the past three years on a monthly basis shows the expected seasonality in our production. We can also see the varying yield each year for any given month, a product of a given month being more overcast or sunny in one year than in another.

We are not always meeting our production goals between the months from October through to January. We have yet to meet the production goal for November, and January isn’t far behind. We suspect that the shading of the adjacent tree during these months is partially responsible for the lower than predicted production.

However, Lisa Albrecht mentioned that this is a trend across her portfolio and she assumes the region. Current forecasting models use 30 years of historic weather data to predict future performance. However, climate models suggest we may experience heavier cloud cover in Q1 & Q4 in our region as our winters warm.

The good news is that based on our net metering agreement the production goals are tallied by solar year, and the excess production during summer makes up for the underproduction in winter.

Worst production

Not necessarily a meaningful data point, but an interesting one. The absence of solar irradiation this past December (2022) manifested itself in a meager output of 273 kWh. Did snow cover have a negative impact? No. We only had two days that produced measurable snow, and I quickly cleared the snow from the array.

Out of the 31 days in December 2022, we had five sunny days (>20 kWh), two mostly sunny days (>15 kWh), and we had 15 gloomy days (<5 kWh). We had to turn lights on during the day for half of that month because it was so overcast.

The worst production day in the past three years was on January 31st, 2021 with a meager 1 Wh. We had a big snow storm moving through and there was no point clearing the snow off the modules until the storm system had left the area the next day and the wind had subsided.

Best production

No need to look any further than the height of summer. June 2022 with 1,495 kWh was the month with the highest yield so far, closely followed by July 2020 with 1,487 kWh.

The high solar irradiance in June of 2020 resulted in 19 mostly sunny days (>50 kWh) and only four mostly overcast days (< 30 kWh). Another 5 kWh in production would have given us a monthly total of 1.5 MWh.

Our highest yielding day in the past three years was on May 29th, 2021 at 68.7 kWh. That came as a surprise, because it was still a good three weeks away from the summer solstice. Humidity levels and the associated haziness around mid to late June must have kept yields below that of May 29th, 2021 for the past three years.

The above production data will set the scene for the next post, where we will compare it against our electrical use.

Related posts:

Photovoltaic roof array shade study

While planning for our photovoltaic roof array, we were looking into optimizing the solar exposure. There are various online resources one can use, and there are site tools such as the solar path finder.

We did an assessment with the solar path finder tool, and knew that certain parts of the roof (or the photovoltaic array) would receive some shade around the winter solstice. With the photovoltaic roof array now installed, we could test those findings.

The biggest shade contributor, as expected, is the roof access enclosure. The good news is that by February 16th the sun is high enough over the horizon that the first row of modules no longer receives shade from the roof access structure.

The vent stacks to the right of the array are also shade contributors. But because all those vents were higher than they needed to be, I was able to lower them and reduce their shading potential.

We also knew that the American ash tree to the west would cast some shade in the afternoon. That tree has since succumbed to the Emerald Ash Borer, and we are now waiting for it to come down.

Related posts:

Inverter installation

We finally had a photovoltaic array on our roof. The solar cells on each module produce direct current (DC). Yet the electricity we use in our buildings is alternating current (AC). To convert the direct current into usable alternating current, we need an inverter.

The direct current from the solar array flows to the inverter, where it is changed to alternating current. The inverter is feeding the electricity into our electrical panel (or load center), from where the alternating current can power electrical loads in our home, such as the heat pump, fridge, dishwasher, vacuum, lights, the TV and radio, our PC’s and laptops, etc. It also feeds electricity back into the electrical grid, which is a process I described in the blog post “How to connect a solar system”.

In other words, our photovoltaic array is not functional, unless it is connected to an inverter.

I had saved some wall space for the inverter in the basement next to our load center. I also had installed a conduit run from the basement up to the roof during construction when we had all the walls open so the big stretch in the middle was already in place. That came very handy, because the electrician just had to install a little bit of extra conduit in the basement and on the roof.

The inverter got wired up from the roof side and connected to the main load center. It also got connected to the internet via our router. That way I can monitor our solar production in real time by logging into the online interface of our inverter.

This sexy little white box has some additional safety functions built into it, such as an automatic safety disconnect, which is an important feature if you have a grid tied system like ours.

The inverter can tell in an instant if there is a power outage. If so, it automatically turns off (or disconnects) and no longer feeds any electricity from the photovoltaic array into the load center and into the electrical grid. This is important because we don’t want to electrocute any line workers fixing the grid during an outage because we are still feeding power into it.

The same safety consideration applies to any maintenance or repair work on the photovoltaic array. By turning off the inverter, we can draw down the power in the roof array and won’t run the risk of getting shocked by a jolt of DC current.

This covers the practical aspects of the inverter installation, which is only half the story. The other half is about connecting to the grid or not and the administrative and contractual implications. These are described in detail in the blog post “How to connect a solar system”.

If you find any of the solar terminology confusing, you find answers in the previous blog post “Solar lingo”.

Related posts:

Solar PV installation

We had been actively preparing for this moment for a long time. The installation of the 8.58 kW photovoltaic roof array with its 26 modules is a massive step towards our goal of achieving net-zero-energy. So, let’s break down the installation process into digestible pieces.

In preparation for the roof solar array installation, we had to fix various items on and around the roof (see “The roof project” for more information). Elements that were directly related to the solar array were the solar blocking to anchor the array to the roof, and the solar posts installation that will support the array, which we carefully coordinated with Lisa Albrecht from All Bright Solar.

The morning of the installation a crate with our 26 solar modules was dropped off, which were carefully unpacked and hoisted onto the roof. It was not really much of a workout, as the modules themselves were rather light.

Up on the roof, the crew began to mount the railing system to the previously installed solar posts, and laid out the wiring of the array. Next the crew set the modules onto the rails, carefully lined them up and bolted them down. Once they were attached, the crew made the final wiring connections and cut off the rail ends to fit.

Now let’s talk about the hidden elements that went into this installation, such as building code requirements. If you look at the photovoltaic array layout, you may ask why we only had four modules in a row, while there would have been space for six modules.

Chicago building code requires a minimum of 36 inch clearance around the array. My understanding is that this is a fire safety provision, i.e. to make roof access to fire fighters easier.

How about the other direction? Why didn’t we space the rows closer together? Why didn’t we  increase the angle of the modules to get a better solar yield?

The answer is: 21. Like December 21st – or the winter solstice. To prevent the modules from casting shadows onto each other, the row spacing and angle of the modules was determined by the sun’s angle at winter solstice.

Are we ready yet to catch some photons? Well, hold your horses! For the photovoltaic array to actually work, we need an inverter, which will be the subject of the next post.

If you find any of the solar terminology confusing, you find answers in the previous blog post “Solar lingo”.

Related posts:

Solar posts

With the roofing membranes and flashing installed, we were finally able to get to the first component of our solar PV array: The solar posts.

PV modules are installed in rows, and mounted on rails, which are in turn attached to the solar posts. A shorter solar post is used along the south side of the row and a longer post on the north side, to give the module a tilt towards the sun.

The solar post assembly consisted of four components:

  1. A base
  2. The post
  3. A curb
  4. Sealant

The base was seated in a layer of sealant and anchored into the solar blocking, which we had previously installed. The post was subsequently screwed tight into the base. The curb was also seated in a layer of sealant over the base and post, and then filled with a sealant composite. This way the roof penetration for the base anchor should be completely waterproof.

I had taken scrupulous measurements for the location of the solar blocking, which was concealed since the installation of the roofing membranes. The big question was, would we be able to accurately trace the location of the blocking with the measurements?

It turned out that we did not need the measurements at all. The morning dew pattern that collected on the roof showed us exactly where the solar blocking was, due to the thermal difference between the lumber used in the blocking and the roof insulation on either side. If you look carefully at the time lapse, you may be able to spot that pattern.

Sometimes a little luck goes a long way.

Related posts: